An in-depth analysis of the factors contributing to the success of Billboard's top hits.
Breaking Down the Secrets of Top Billboard Hits
Welcome back! If you’ve been following along, you know we’ve been digging into the data behind Billboard’s biggest hits. Today, we’ll break down what makes a song chart-topping material, how musical trends have shifted, and how you can interactively explore these changes yourself.
What You’ll Find in This Post
- A quick recap of our data sources and previous findings
- Visual breakdowns of genre and mood shifts from 1969 to 2019
- A hands-on walkthrough of our interactive Streamlit app
- Tips on how to explore the data for your own insights
Recap: Setting the Stage
In our last post, we covered how to fetch acoustic features of Billboard Hot 100 hits from both 1969 and 2019 using API calls. We also introduced some basic exploratory data analysis (EDA) techniques. This time, we’re going deeper—looking at how features like tempo, key, and energy relate to chart performance, and how these features differ across genres and decades.
How Has Music Changed Over Time?
Key Takeaways
- Older hits (1969) tended to be happier and featured more male artists.
- Newer hits (2019) show greater artist diversity and lean sadder in mood.
Genre Evolution
Let’s visualize how genre popularity has shifted:
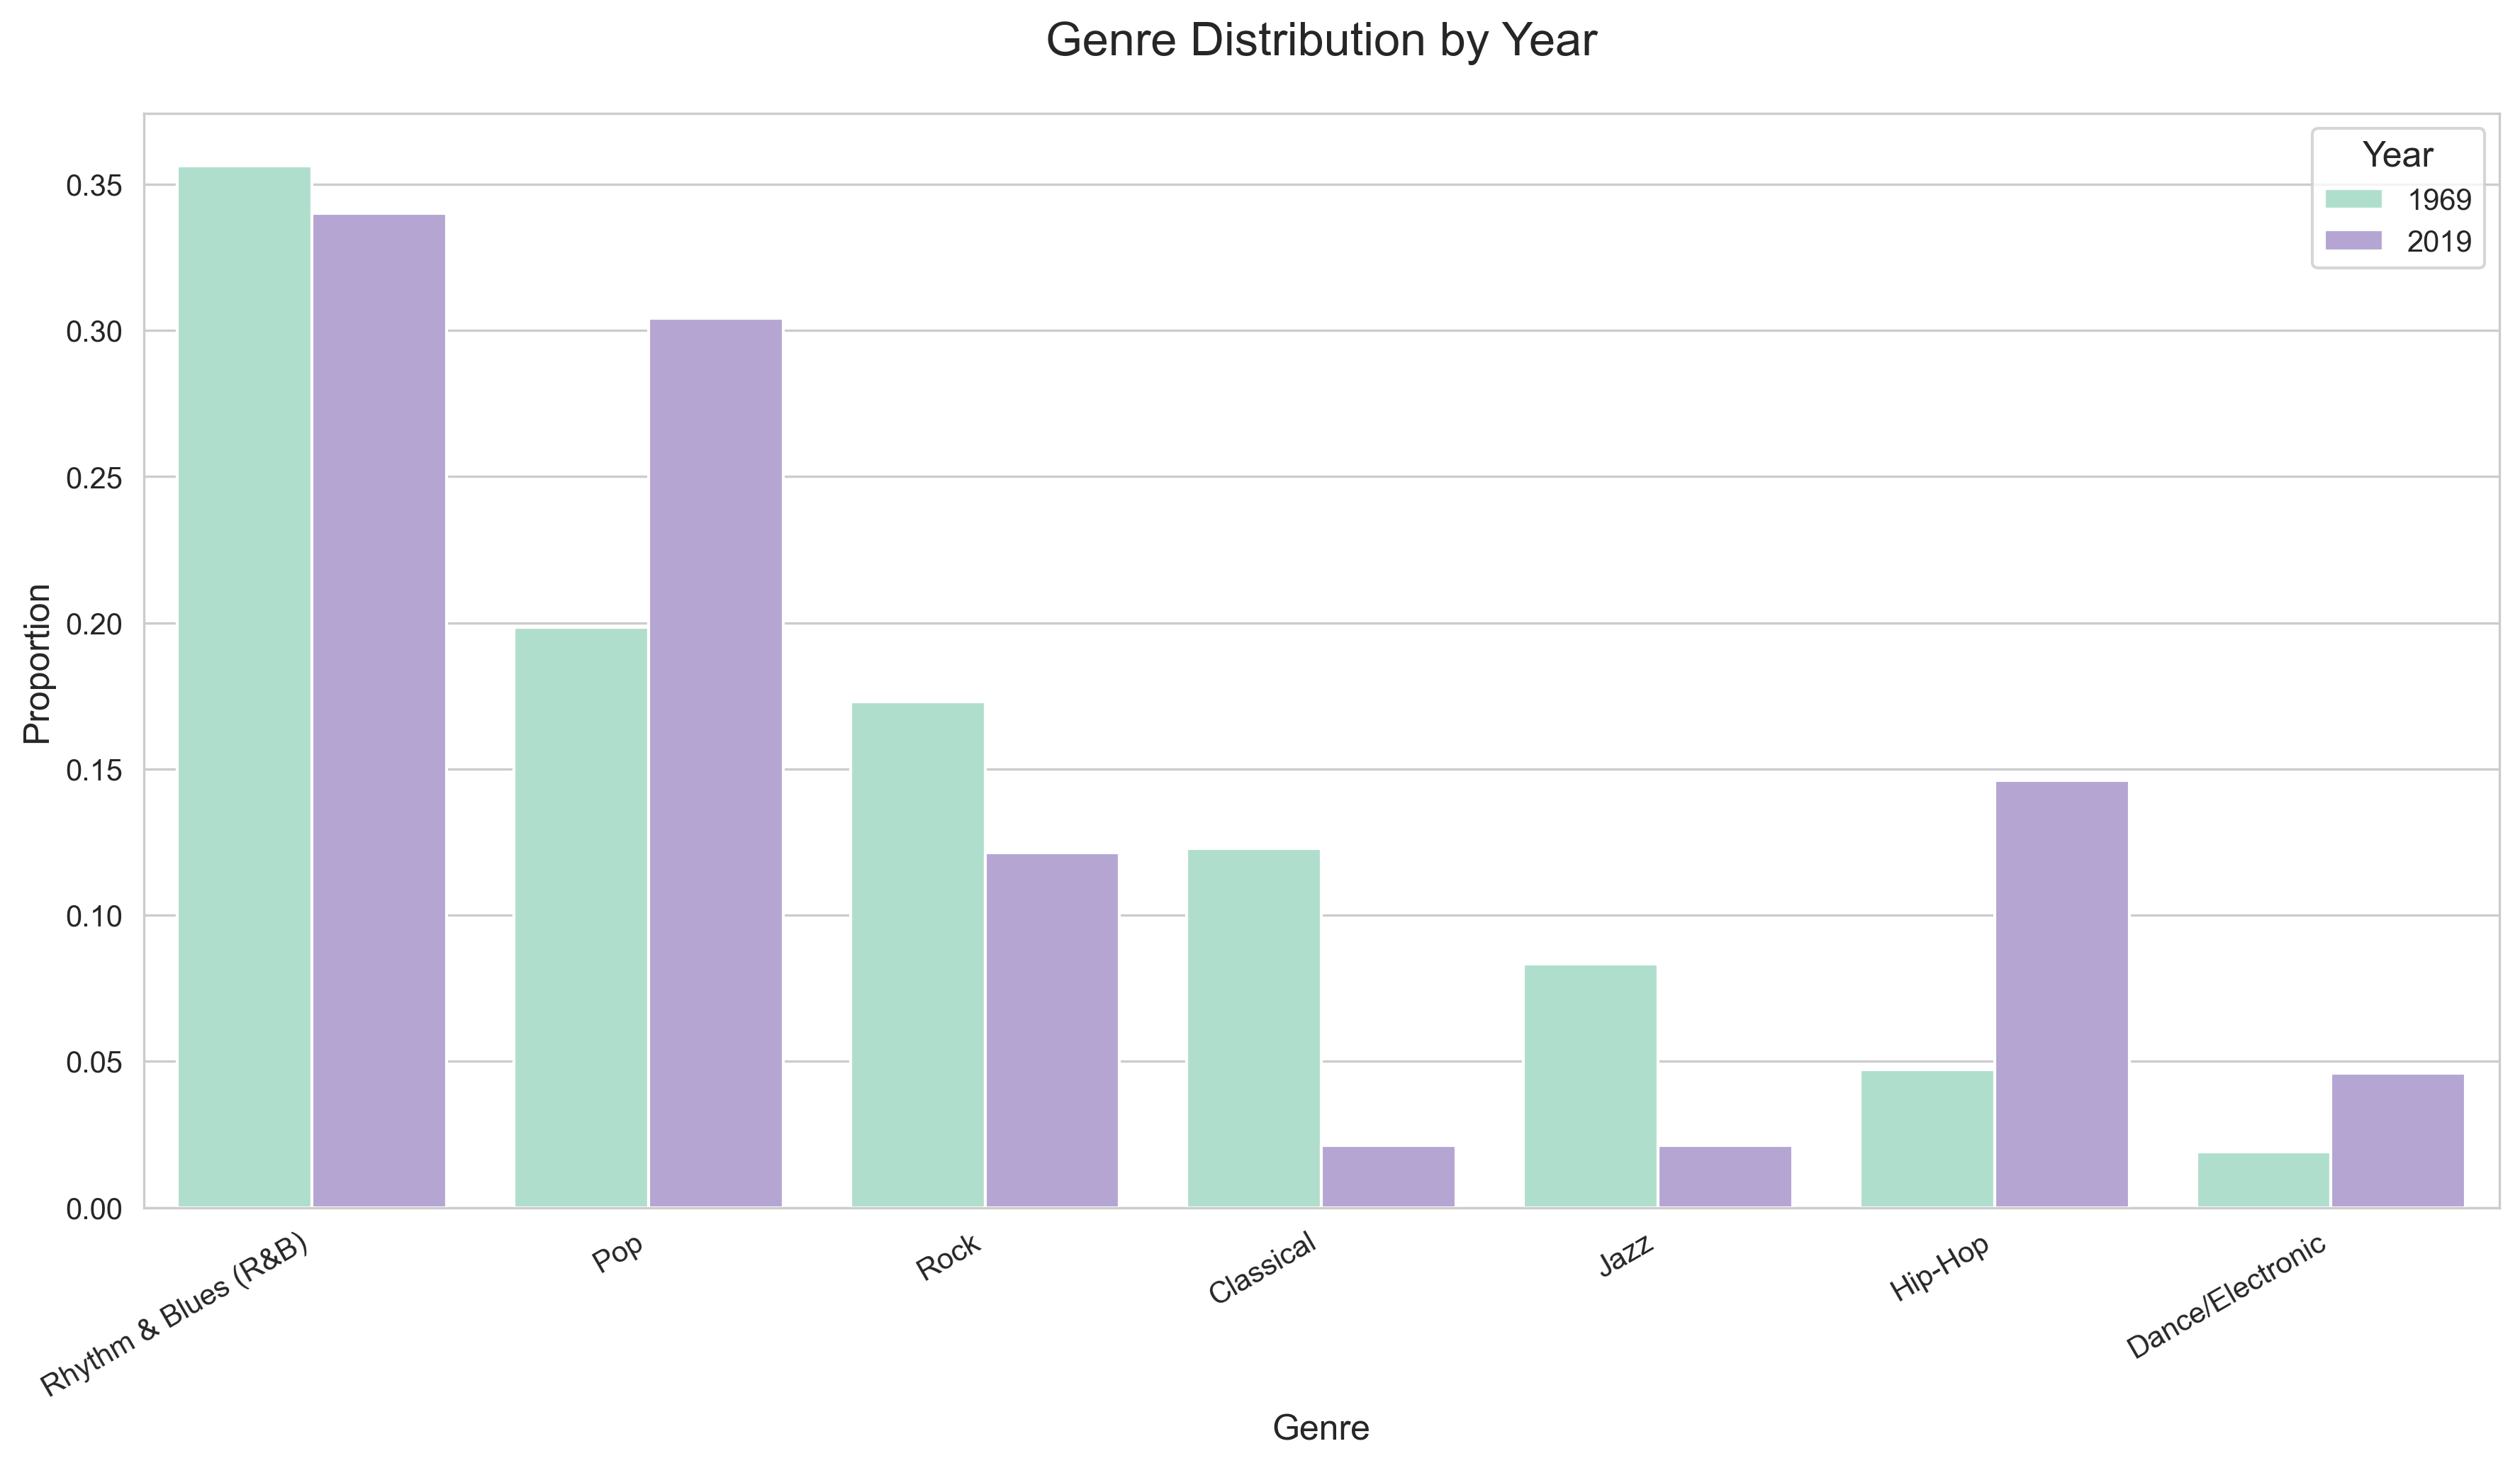
What’s changed?
- Jazz and classical genres have faded from the charts.
- Pop and hip-hop have surged, reflecting cultural shifts and new artist influences.
Mood on the Charts
Now, let’s see how mood and chart success intersect:

Observations:
- In 2019, top-charting songs tend to be sadder, especially those with longer chart runs.
- In 1969, most hits were happier, but interestingly, the #1 songs were often sad.
- This pattern could suggest that emotional resonance, not just cheerfulness, drives a song’s staying power.
Try It Yourself: Interactive Data App
We built a Streamlit app to let you explore these trends hands-on.
Getting Started
When you open the app, you’ll see a sidebar with filters:
- Year Selector: Focus on 1969, 2019, or both.
- Genre Filter: Zero in on specific genres.
- Weeks on Chart: Filter for songs with real staying power.
There’s also a handy “How To Use” section in the sidebar for quick guidance.
📊 Overview Tab
This tab gives you a high-level summary of your filtered dataset, helping you spot broad trends at a glance.
What you’ll see:
- Total Songs Analyzed: Instantly see how many songs match your current filters. This helps you gauge the size of your data slice and ensures your analysis is focused.
- Average Weeks on Chart: Find out how long, on average, songs stay on the Billboard Hot 100. This can reveal how competitive the music landscape is in different years or genres.
- Genre Proportions by Year: Compare how popular genres have changed over time. For example:
- Is pop dominating in recent years?
- Did rock or jazz have a bigger share in the past?
- Are there any emerging genres gaining traction?
How to use it:
Adjust the filters to focus on specific years or genres and watch how the genre proportions shift. This is a great way to spot macro trends, such as the rise of hip-hop or the decline of classical hits on the charts.
😊 Mood Analysis Tab
This tab lets you dig into the emotional tone of chart-topping music.
Choose your view:
- Year Comparison: See the proportion of “happy” vs. “sad” songs each year.
- Are chart hits getting sadder or happier over time?
- Does a particular year stand out as unusually upbeat or melancholic?
- Genre Breakdown: Explore which genres are associated with happier or sadder songs.
- Is pop generally happier than hip-hop?
- Do certain genres shift in mood over the decades?
How to use it:
Switch between views to answer questions like:
- Has the mood of top hits changed with cultural events or trends?
- Are there genres that consistently produce more uplifting (or more somber) hits?
👫 Gender Trends Tab
This tab highlights artist representation and success across genders.
Explore:
- Gender Proportions by Year: Track how the gender balance among charting artists has shifted.
- Are there more female or male artists in recent years?
- Weeks on Chart by Gender: See which gender groups have the longest chart presence.
- Do males or females seem to have staying power on the Billboard Hot 100?
- Has this changed over time?
How to use it:
Use these insights to discuss broader industry trends, such as increasing diversity or persistent disparities. Try comparing different genres or decades to see where gender gaps are narrowing or widening.
🎵 Custom Analysis Tab
This is your “sandbox” for creative exploration.
Get creative:
- Pick any two features (e.g., “peak position” vs. “weeks on chart”, “bpm” vs. “loudness”) to see how they relate.
- Color by mood, gender, or year to add another dimension to your analysis.
- Split by year for side-by-side comparisons.
How to use it:
Ask your own questions, such as:
- Do happier songs tend to chart higher?
- Is there a relationship between tempo (bpm) and chart longevity?
- Are there gender or genre differences in how long songs stay on the charts?
Tip:
Try combining filters and color options to uncover non-obvious patterns—like whether sad songs in pop last longer than happy songs in rock, or if 2019’s hits are generally louder than those from 1969.
How to Get the Most Out of the App
- Adjust Filters: Narrow down to specific years, genres, or chart longevity to spot patterns.
- Switch Tabs: Each tab offers a different lens on the data—try them all!
- Customize Visuals: Use the “Custom Analysis” tab to test your own hypotheses.
Want to Dig Deeper?
- Original API and EDA post
- Streamlit app for hands-on exploration
- GitHub repository for the code and data: GitHub Repo
Wrapping Up
The world of chart-topping music is always evolving. By exploring data on song features, genres, moods, and artist demographics, we can uncover the trends that define each era. Use the interactive app to find your own insights—and let us know what surprises you!
What trends did you find? Share your findings or questions in the comments below!